docs: Small update to docs

TBR: primiano
Change-Id: I0fb51d7eee6bf39218bc09615950bd0d9f7d20d5
diff --git a/docs/README.md b/docs/README.md
index ade8124..3a633f0 100644
--- a/docs/README.md
+++ b/docs/README.md
@@ -11,14 +11,27 @@
**OS-wide Linux/Android probes for platform debugging**
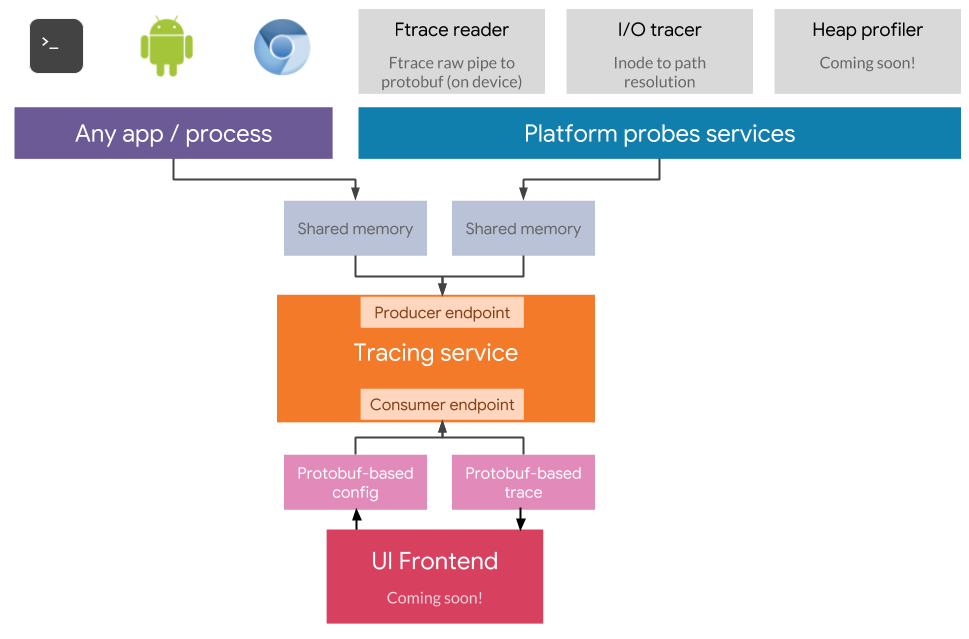
* Kernel tracing: a daemon that converts Kernel [Ftrace][ftrace] events into
API-stable protobufs, on device, with low overhead.
+* [Heap profiling](heapprofd): low-overhead, out of process unwinding,
+ variable sample rate, attachable to already running processes.
+* Power rails sampling
+* System stat counters
+* Chrome userspace tracing
* I/O tracing
* Many new probes coming soon: heap profiling, perf sampling, syscall tracing.
-**Web-based frontend**
-A UI for inspection and analysis of traces (coming soon).
+**Processing of traces**
+A C++ library for efficient processing and extraction of trace-based
+metrics.](trace-processor). The library accepts both protobuf and json-based
+traces as input and exposes an SQL query interface to the data.
+The library is built to be linked by other programs but can also be used
+standalone as a command line tool.
-**Batch processing of traces**
-A python / C++ (TBD) library for trace-based metrics (coming soon).
+
+**Web-based frontend**
+An open-source UI for inspection and analysis of traces.
+Available at [ui.perfetto.dev][https://ui.perfetto.dev].
+The UI is built on top of C++ trace processor library whic is cross-compiled
+to WASM to run locally in the browser.
