| commit | c56c2429b0f6970c05d630f05acf44b6ada2f346 | [log] [tgz] |
|---|---|---|
| author | Hector Dearman <hjd@google.com> | Tue Jul 03 09:50:03 2018 +0100 |
| committer | Hector Dearman <hjd@google.com> | Tue Jul 03 09:50:03 2018 +0100 |
| tree | d65a635b815d7edec8093a280cc560697ced1647 | |
| parent | ea4bcdc1e7f40770e068833fceda0ac3d4a97aa9 [diff] |
perfetto-ui: Plumb trace_processor to javascript

src/trace_processor/wasm_bridge.cc is our entry point to the
WASM code it exports an Initialize function and also one function for
each rpc in each proto service implemented by the trace_processor
(a subset of protos/perfetto/trace_processor/*).

The Initialize method takes two functions which are implemented on the
javascript side:
- reply
  This is how the trace_processor replies to rpc requests.
- read
  This is the interface the trace_processor uses to read parts of the
  trace file.

ui/src/engine/wasm_bridge.ts is the typescript counterpart to
wasm_bridge.cc. It lives in a dedicated worker thread.

Initialization flow is:
1) The worker thread (wasm.ts) starts up creating WasmBridge
2) this starts up the WASM
3) the worker calls WasmBridge#initialize
4) WasmBridge#initialize (asynchronously) waits for the WASM module
   to start up to complete (including WASM compilation)
5) WasmBridge#initialize (asynchronously) waits the file to arrive
6) WasmBridge#initialize calls the C++ initialize, the C++ begins
   reading the trace via the provided read method.
7) The C++ initialization is complete we call the reply method
8) The ts WasmBridge issues any calls to the WASM which had been
   queued while the C++ was setting up.

Change-Id: Iec86ea06124b0405d7cf16c509c37a5570406930
- gn/standalone/wasm_typescript_declaration.d.ts[diff]
- protos/perfetto/trace_processor/proto_files.gni[diff]
- protos/perfetto/trace_processor/trace_processor.proto[Added - diff]
- src/trace_processor/BUILD.gn[diff]
- src/trace_processor/wasm_bridge.cc[diff]
- ui/PRESUBMIT.py[diff]
- ui/index.html[diff]
- ui/src/base/deferred_unittest.ts[diff]
- ui/src/engine/index.ts[diff]
- ui/src/engine/wasm_bridge.ts[Added - diff]
- ui/src/engine/wasm_bridge_unittest.ts[Added - diff]
- ui/src/engine/wasm_engine_proxy.ts[Added - diff]
- ui/src/main.ts[diff]
- ui/src/protos.ts[diff]
- ui/src/wasm.ts[diff]
- build_overrides/
- buildtools/
- debian/
- docs/
- gn/
- include/
- infra/
- protos/
- src/
- test/
- tools/
- ui/
- .clang-format
- .gitignore
- .gn
- .travis.yml
- Android.bp
- Android.bp.extras
- BUILD.gn
- codereview.settings
- MODULE_LICENSE_APACHE2
- NOTICE
- OWNERS
- perfetto.rc
- PRESUBMIT.py
- README.chromium
- README.md
Perfetto - Performance instrumentation and tracing
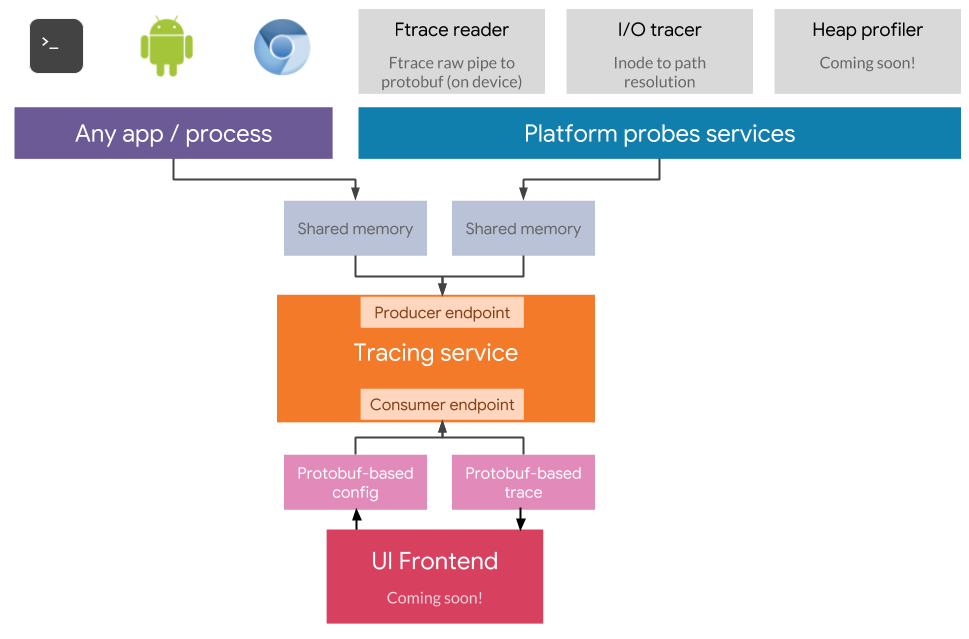
Perfetto is an open-source project for performance instrumentation and tracing of Linux/Android/Chrome platforms and user-space apps.
It consists of:
A portable, high efficiency, user-space tracing library
designed for tracing of multi-process systems, based on zero-alloc zero-copy zero-syscall (on fast-paths) writing of protobufs over shared memory.
OS-wide Linux/Android probes for platform debugging
- Kernel tracing: a daemon that converts Kernel Ftrace events into API-stable protobufs, on device, with low overhead.
- I/O tracing
- Many new probes coming soon: heap profiling, perf sampling, syscall tracing.
Web-based frontend
A UI for inspection and analysis of traces (coming soon).
Batch processing of traces
A python / C++ (TBD) library for trace-based metrics (coming soon).
Goals
Perfetto is building the next-gen unified tracing ecosystem for:
- Android platform tracing (Systrace)
- Chrome platform tracing (chrome://tracing)
- App-defined user-space tracing (including support for non-Android apps).
The goal is to create an open, portable and developer friendly tracing ecosystem for app and platform performance debugging.
Key features
Designed for production
Perfetto's tracing library and daemons are designed for use in production. Privilege isolation is a key design goal:
- The interface for writing trace events are decoupled from the interface for read-back and control and can be subjected to different ACLs.
- Despite being based on shared memory, Perfetto is designed to prevent cross-talk between data sources, even in case of arbitrary code execution (memory is shared point-to-point, memory is never shared between processes).
- Perfetto daemons are designed following to the principle of least privilege, in order to allow strong sandboxing (via SELinux on Android).
See docs/security-model.md for more details.
Long traces
Pefetto aims at supporting hours-long / O(100GB) traces, both in terms of recording backend and UI frontend.
Interoperability
Perfetto traces (output) and configuration (input) consists of protobuf messages, in order to allow interoperability with several languages.
See docs/trace-format.md for more details.
Composability
As Perfetto is designed both for OS-level tracing and app-level tracing, its design allows to compose several instances of the Perfetto tracing library, allowing to nest multiple layers of tracing and drive then with the same frontend. This allows powerful blending of app-specific and OS-wide trace events. See docs/multi-layer-tracing.md for more details.
Portability
The only dependencies of Perfetto's tracing libraries are C++11 and Protobuf lite (plus google-test, google-benchmark, libprotobuf-full for testing).
Extensibility
Perfetto allows third parties to defined their own protobufs for:
Allowing apps to define their own strongly-typed input and output schema. See docs/trace-format.md for more details.